Simple linear regression
In the previous chapter, we learned that training data is used to estimate the parameters of a model in supervised learning problems. Observations of explanatory variables and their corresponding response variables comprise training data. The model can be used to predict the value of the response variable for values of the explanatory variable that have not been previously observed. Recall that the goal in regression problems is to predict the value of a continuous response variable. In this chapter, we will examine simple linear regression, which can be used to model a linear relationship between one response variable and one feature representing an explanatory variable.
Suppose you wish to know the price of a pizza. You might simply look at a menu. This, however, is a machine learning book, so instead we will use simple linear regression to predict the price of a pizza based on an attribute of the pizza that we can observe, or an explanatory variable. Let's model the relationship between the size of a pizza and its price. First, we will write a program with scikit-learn that can predict the price of a pizza given its size. Then we will discuss how simple linear regression works and how it can be generalized to work with other types of problems.
Let's assume that you have recorded the diameters and prices of pizzas that you have previously eaten in your pizza journal. These observations comprise our training data:

We can visualize our training data by plotting it on a graph using matplotlib:
# In[1]:
import numpy as np  # "np" and "plt" are common aliases for NumPy and
  Matplotlib, respectively.
import matplotlib.pyplot as plt

# X represents the features of our training data, the diameters of the pizzas.
# A scikit-learn convention is to name the matrix of feature vectors X.
# Uppercase letters indicate matrices, and lowercase letters indicate vectors.
X = np.array([[6], [8], [10], [14], [18]]).reshape(-1, 1)
y = [7, 9, 13, 17.5, 18]  # y is a vector representing the prices of
  the pizzas.

plt.figure()
plt.title('Pizza price plotted against diameter')
plt.xlabel('Diameter in inches')
plt.ylabel('Price in dollars')
plt.plot(X, y, 'k.')
plt.axis([0, 25, 0, 25])
plt.grid(True)
plt.show()
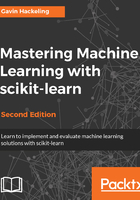
The comments in the script state that X represents a matrix of pizza diameters, and y represents a vector of pizza prices. The reasons for this decision will become clear in the next chapter. This script produces the following plot. The diameters of the pizzas are plotted on the x axis, and the prices are plotted on the y axis:

We can see from the plot of the training data that there is a positive relationship between the diameter of a pizza and its price, which should be corroborated by our own pizza-eating experience. As the diameter of a pizza increases, its price generally increases. The following pizza price predictor program models this relationship using simple linear regression. Let's review the program and discuss how simple linear regression works:
# In[2]:
from sklearn.linear_model import LinearRegression
model = LinearRegression()  # Create an instance of the estimator
model.fit(X, y)  # Fit the model on the training data

# Predict the price of a pizza with a diameter that has never been seen before
test_pizza = np.array([[12]])
predicted_price = model.predict(test_pizza)[0]
print('A 12" pizza should cost: $%.2f' % predicted_price)

# Out[2]:
A 12" pizza should cost: $13.68
Simple linear regression assumes that a linear relationship exists between the response variable and the explanatory variable; it models this relationship with a linear surface called a hyperplane. A hyperplane is a subspace that has one dimension less than the ambient space that contains it. In simple linear regression, there is one dimension for the response variable and another dimension for the explanatory variable, for a total of two dimensions. The regression hyperplane thus has one dimension; a hyperplane with one dimension is a line.
The LinearRegression class is an estimator. Estimators predict a value based on observed data. In scikit-learn, all estimators implement the fit methods and predict. The former method is used to learn the parameters of a model, and the latter method is used to predict the value of a response variable for an explanatory variable using the learned parameters. It is easy to experiment with different models using scikit-learn because all estimators implement the fit and predict methods; trying new models can be as simple as changing one line of code. The fit method of LinearRegression learns the parameters of the following model for simple linear regression:
In the preceding formula, y is the predicted value of the response variable; in this example, it is the predicted price of the pizza. x is the explanatory variable. The intercept term α and the coefficient β are parameters of the model that are learned by the learning algorithm. The hyperplane plotted in the following figure models the relationship between the size of a pizza and its price. Using this model, we would expect the price of an 8" pizza to be about $7.33 and the price of a 20" pizza to be $18.75.

Using training data to learn the values of the parameters for simple linear regression that produce the best fitting model is called ordinary least squares (OLS) or linear least squares. In this chapter, we will discuss a method for analytically solving the values of the model's parameters. In subsequent chapters, we will learn approaches for approximating the values of parameters that are suitable for larger datasets. First, however, we must define what it means for a model to fit the training data.