上QQ阅读APP看书,第一时间看更新
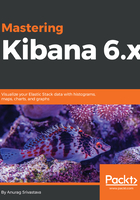
Dragging and dropping visualizations on a desired location on the dashboard
When using the dashboard, we want to show the key performance indicators at the top. To do this, we have to put the cursor on the visualization header and drag and drop it to the desired location:
